70 years of research leads to this forecasting method used by CBS19 Chief Meteorologist Brett Anthony
The Lezak Recurring Cycle is a long-range weather prediction model that has proved time and time again to be accurate.
Brett Anthony
WELCOME TO THE LEZAK RECURRING CYCLE
What if I told you we could see into the future of weather forecasting? I’ve been working for more than a decade with a team of meteorologists who trust in a long-range forecasting method called the Lezak Recurring Cycle (LRC) theory.
The theory asserts every Autumn, as the jet stream becomes energized, a unique weather pattern sets up and begins to cycle. Every year the length of the cycle is different. I was one of the authors of an article published in January 2018 in the Journal of Climatology & Weather Forecasting. If you want an in depth look at the LRC, read the article called Cycling Weather patterns in the Northern Hemisphere, 70 years of research and a New Hypothesis. Understanding the theory can be confusing because the trick in using this forecasting method is finding the cycle and recognizing the subtle differences each time a storm reappears.
THIS YEAR’S PATTERN
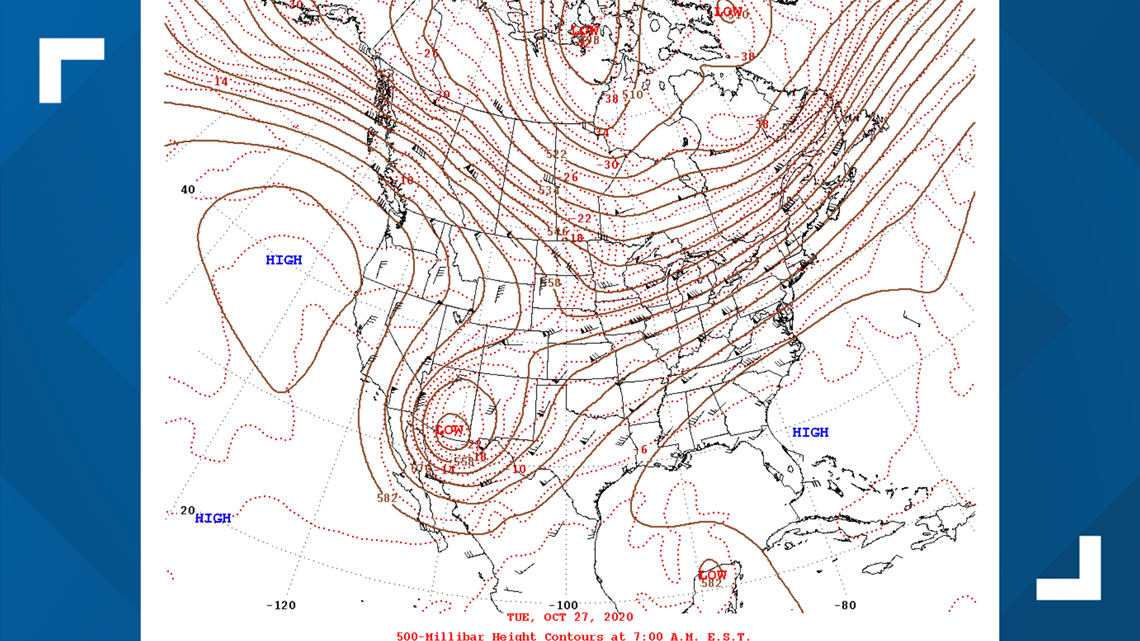
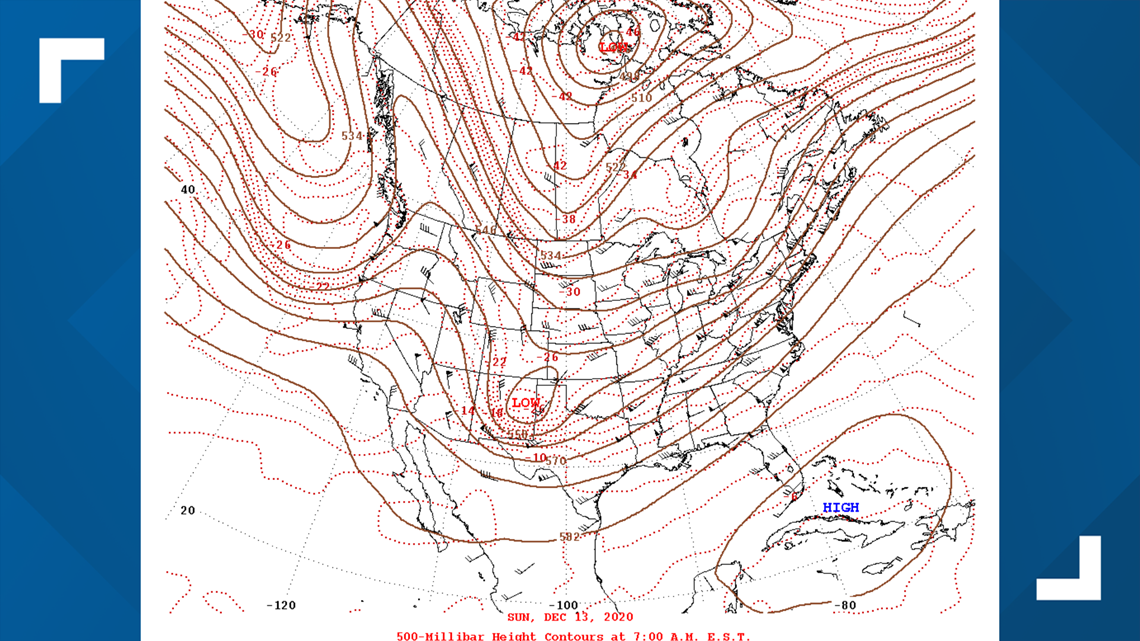
The first storm of this year’s pattern showed up during the middle of October. We identified this storm as a potential signature storm in this year’s pattern. But a more significant storm showed up in late October. It brought three days of rain to Tyler. The same pattern cycled through the southern plains again in mid-December bringing the Tyler area an inch-and-a-half of rain over a three-day period. Here is a side by side comparison of those storms. The first one is October 27 and the second storm appeared December 13.


USING THE LRC
My goal is to use the LRC in conjunction with the regular suite of forecast models to bring you the most accurate forecast in East Texas.
Sometimes meteorologists get caught up in something we refer to as modelitis.
What’s that?
It’s when we rely only computer model output to put together a forecast and disregard other factors that could play into the forecast.
For example, some computer models have warm or cold biases. Some over predict or under predict rain or snow amounts. Precise forecasting for a storm that’s still over the Pacific Ocean can be a slippery slope. Since weather balloons aren’t launched over the ocean the data that’s sampled can be missing or incomplete.
If we plug the LRC into the equation, we can get a better feel for what will happen.
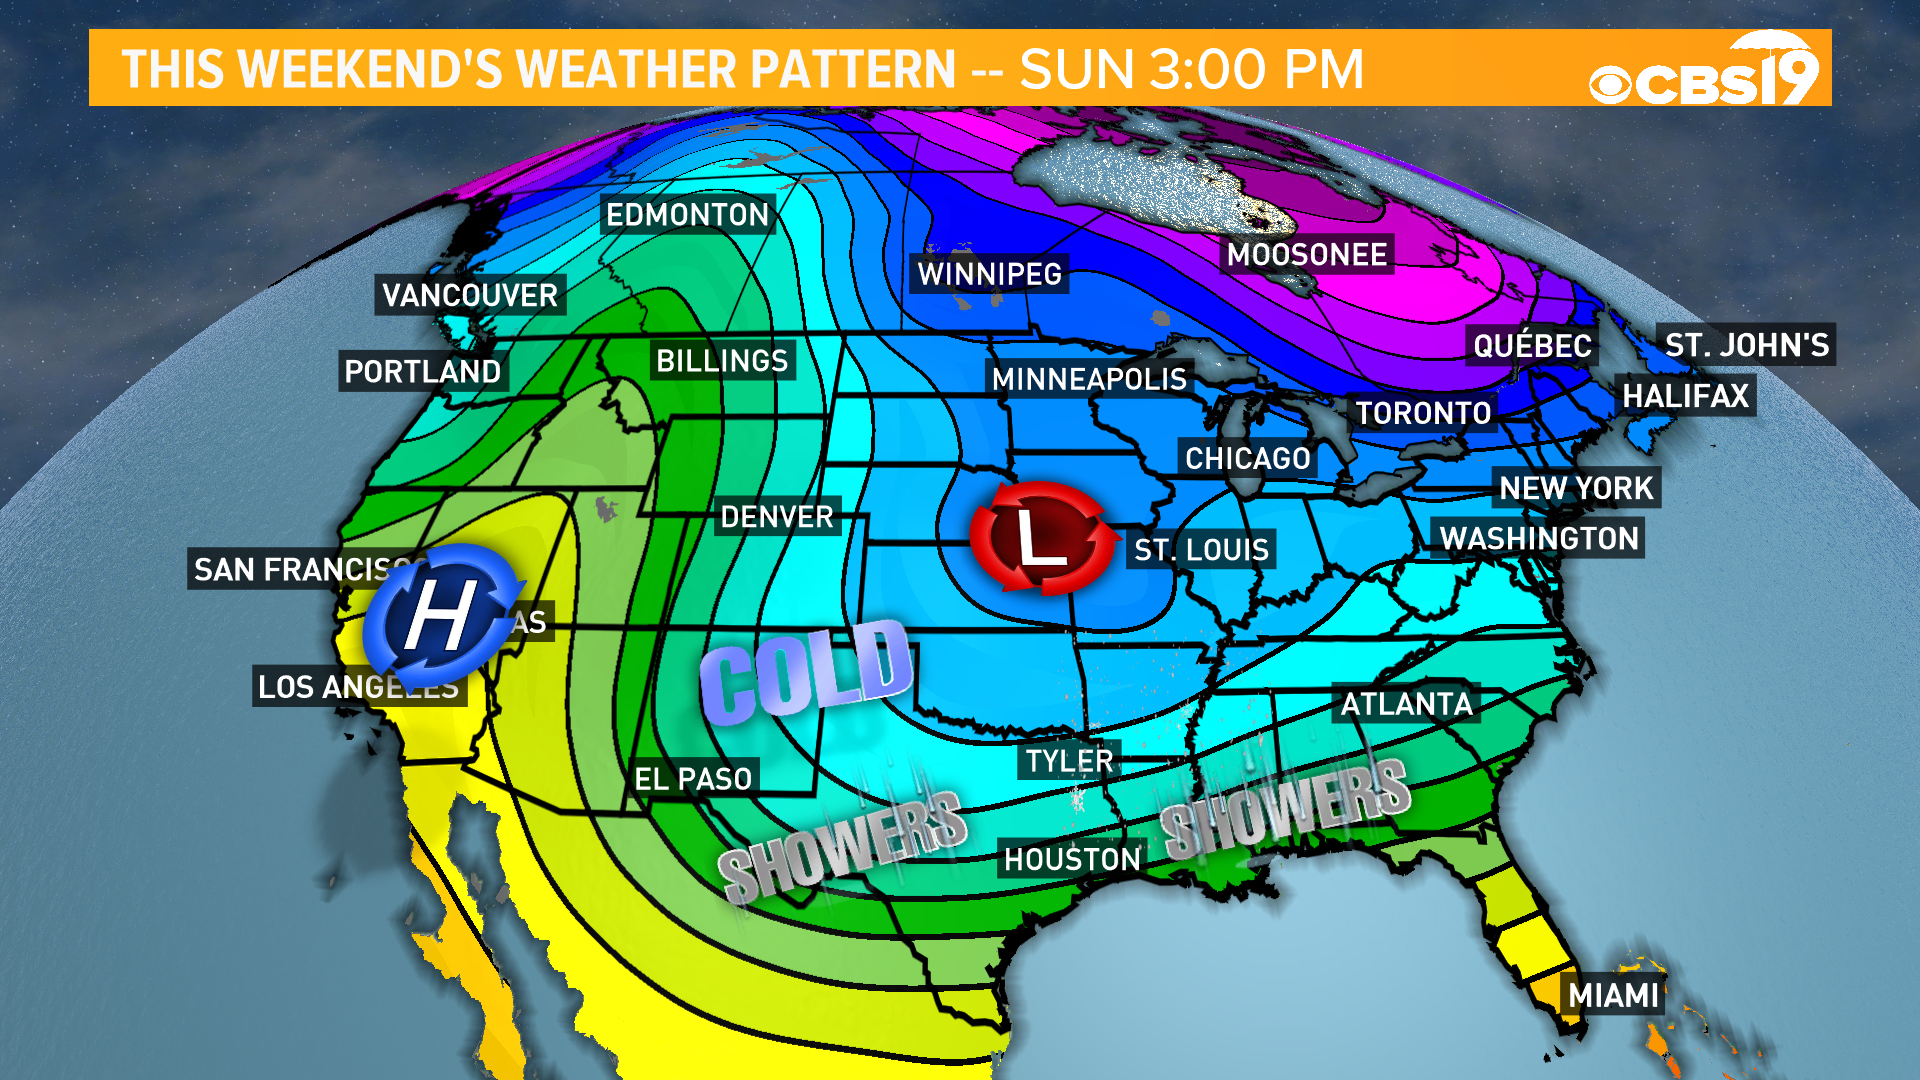
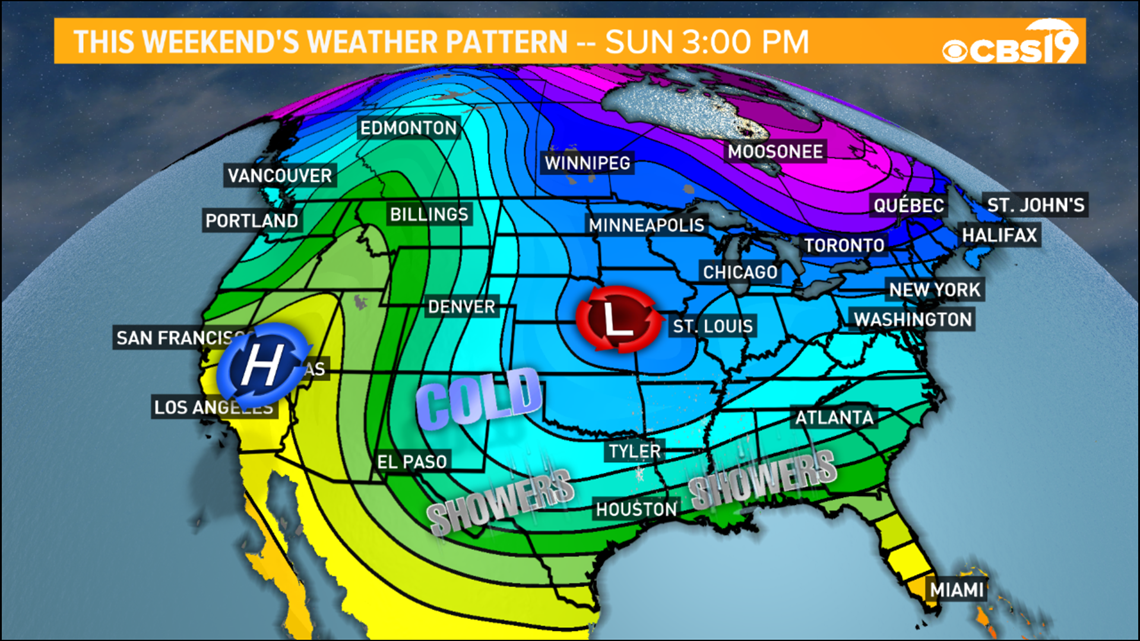
For instance, there is a storm forecast to move across East Texas this weekend. Here’s what that storm should look like at about 25,000 feet off the surface of the Earth. This is about halfway up through the atmosphere or about 500 millibars. Remember what happens aloft is often reflected on the Earth’s surface.

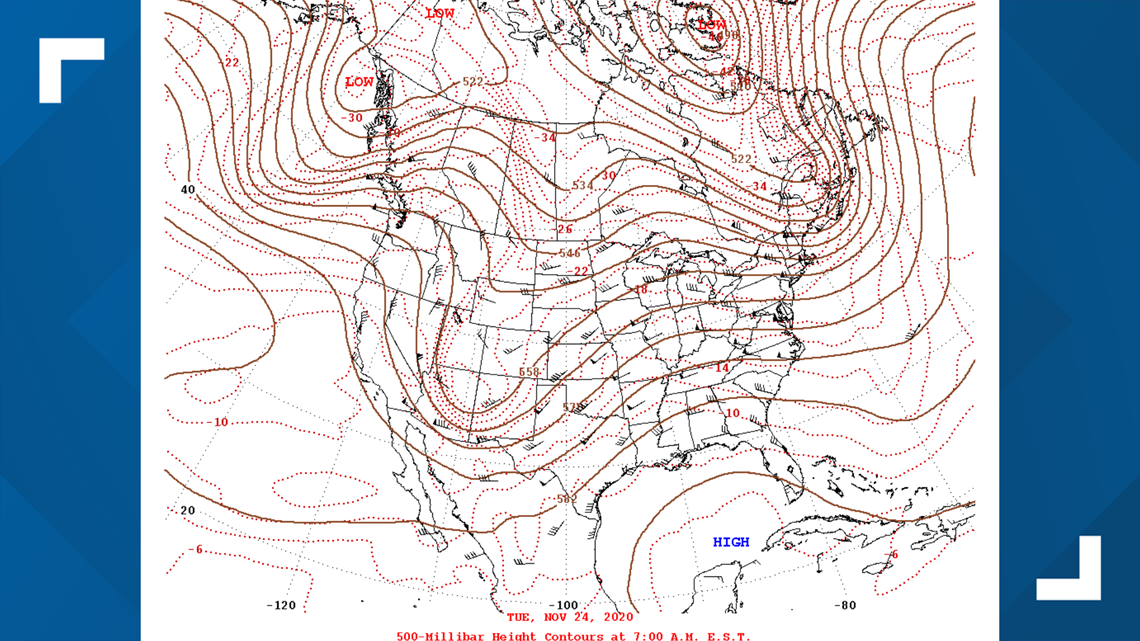
Compare this weekend's storm to a similar version that moved through the central and southern plains in late November.

DATES TO REMEMBER
Keying in signatures within the overall weather pattern gives an idea of what storms could cause wintry weather, flooding rains or severe and tornadic thunderstorms.
We’ve already talked about the signature storm in late October that repeated in mid-December. Look for an active weather pattern to return to the central and southern plains, including East Texas in late January.
Smaller, fast moving storms will zip through East Texas around January 12 and again between the 15-19, followed closely behind by another storm around January 22 ahead of the signature at the end of the month.
The weather pattern will settle down in early February, but a new series of storms will need to be and watched between February 9-15, February 22-24 and right around February 26.
I’ll post an update in late February as we look ahead to how severe weather could be setting up in March.
If you have any questions about the LRC, please email me at banthony@cbs19 or follow me on Facebook or Twitter.
Thanks for reading about the LRC and welcome to the journey of the future of forecasting!
